24 Mar 2025
Orion Macapella
Customer service


Let’s face it—if you’re reading this, you’ve probably spent hours staring at spreadsheets wondering if your customer service metrics are worth the carpal tunnel syndrome. Spoiler alert: they are! These metrics aren’t just soul-crushing numbers in a dashboard; they’re your backstage pass to the bizarre comedy show that is customer behaviour.
Think of them as your crystal ball of customer satisfaction, except instead of mystical fog and flowing robes, you get actionable insights and fewer customers plotting your demise on Trustpilot. Understanding why customer service metrics are important is crucial for enhancing customer experience and organizational effectiveness.
Here’s the not-so-funny truth: 65% of customers will ghost you faster than a bad date after just ONE poor service experience. Ouch! But before you start stress-eating your emergency stash of office snacks, there’s good news. Companies that master these metrics aren’t just winning popularity contests – they’re seeing 2.4 times higher customer lifetime value. Measuring customer service performance is essential for maintaining high service standards and improving customer experiences throughout the customer journey.
Tools like Cue empower you to monitor and optimise these metrics effectively. With functions like real-time analytics and AI-driven solutions, you can reduce operational costs by up to 40% and exceed your business goals.
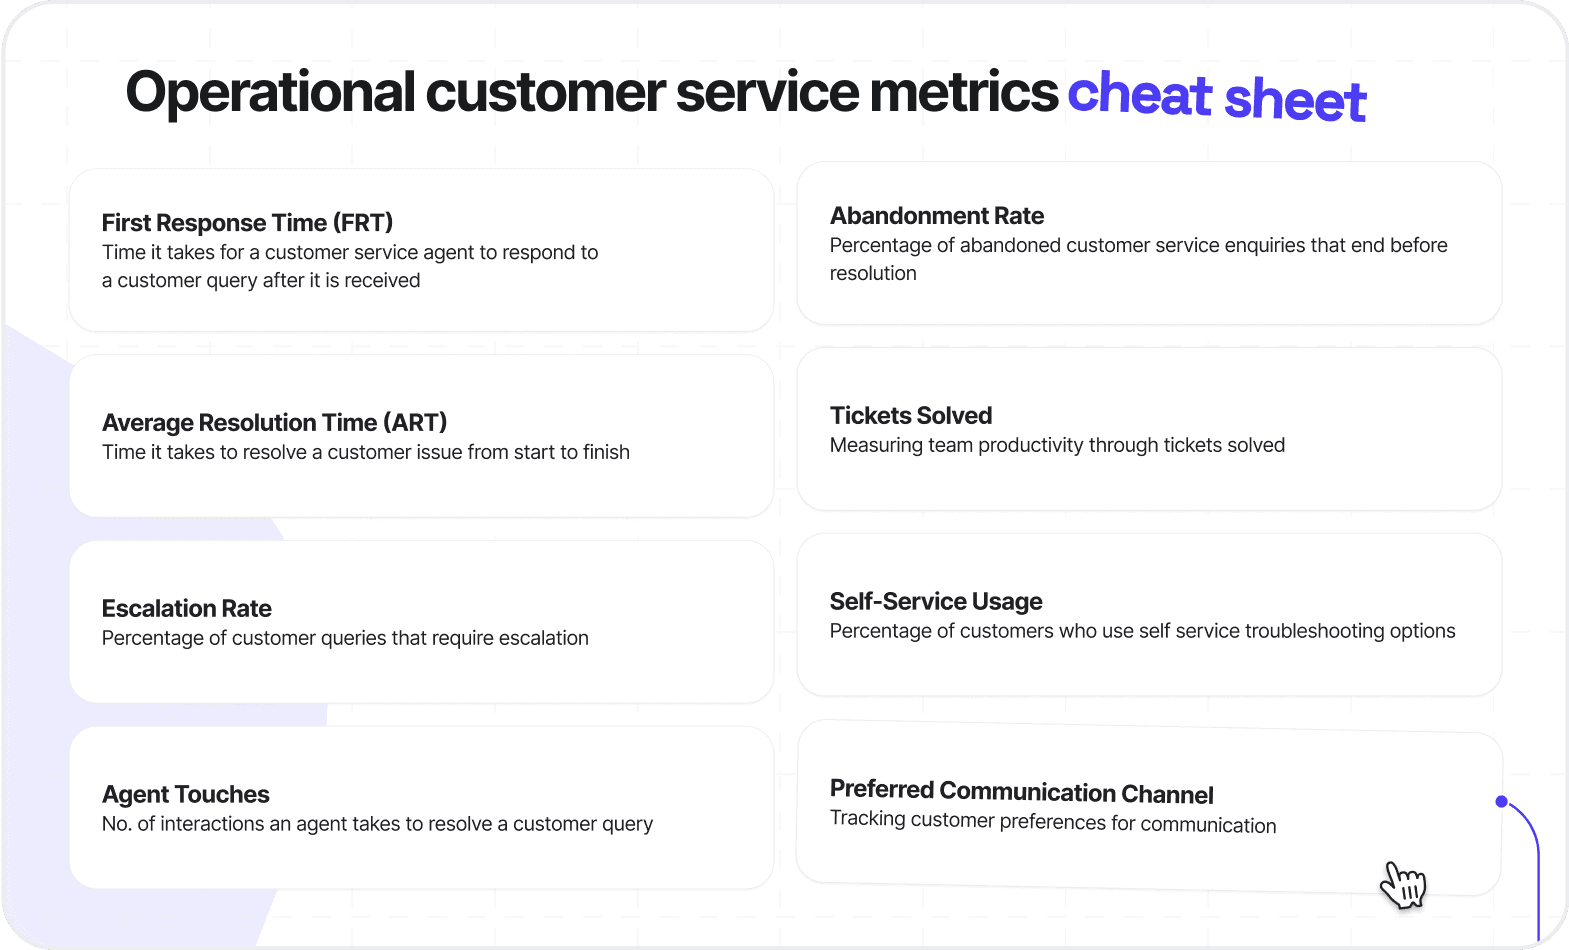
Operational customer service metrics
First response time (FRT)
First Response Time (FRT) measures the time it takes for a customer service agent to respond to a customer query after it is received. This metric is crucial because it directly impacts customer satisfaction. A quick response reassures customers that their concerns are being addressed, fostering trust and loyalty.
Studies show that customers are more likely to remain loyal to businesses that respond promptly to their queries. Tracking FRT is essential to measure customer service performance, as it helps evaluate and improve the overall customer experience.
How to measure and improve FRT
To measure FRT, calculate the average time between when a customer submits a query and when your team provides the first response. Tools like Cue simplify this process by offering real-time analytics and tracking capabilities.
Automation plays a significant role in reducing FRT. For instance, Cue AI-driven chatbots can provide instant replies to customer inquiries, ensuring no query goes unanswered. This allows your team to focus on more complex issues.
Average resolution time
Average Resolution Time (ART) measures the time it takes to resolve a customer issue from start to finish. It plays a crucial role in measuring customer service performance and assessing the effectiveness of your support team. Faster resolution times lead to higher customer satisfaction and loyalty, while delays can result in frustration and churn.
Resolution times vary depending on the support channel. For example:
Email support typically has an ART of around 24 hours.
Phone support averages between 10-60 minutes.
Live chat offers the fastest ART, ranging from 5-10 minutes.
Quicker resolutions not only improve customer relationships but also enhance your team’s productivity.
Reduce resolution time with AI and automation
Reducing resolution time requires addressing common challenges such as unstructured processes, complicated troubleshooting, and disconnected channels. Here are some strategies to overcome these issues:
Implement structured troubleshooting procedures to guide agents through the resolution process.
Use AI-powered tools like Cue to automate repetitive tasks and provide instant solutions to common queries.
Integrate customer service platforms that centralise channels, customers, and conversations, reducing the need for agents to toggle between multiple screens or apps.
Escalation rate
The escalation rate measures the percentage of customer queries that require escalation to higher-level support. A high escalation rate often indicates gaps in your team's training or inefficiencies in your processes. On average, only 5% of organisations achieve an exceptional first contact resolution (FCR) rate of 80% or higher. This means a significant portion of tickets may require escalation, which can negatively impact customer satisfaction.
Monitoring this metric helps you identify recurring issues and improve your team's ability to handle complex queries effectively.
Tips to minimise escalations using shared inboxes
Minimising escalations involves equipping your team with the right tools and training. Here are some effective strategies:
Provide scenario-based training to prepare agents for handling complex situations.
Implement structured troubleshooting flows to guide agents through problem-solving.
Use intelligent call routing to ensure queries are directed to the most qualified agents.
Shared inbox functionality doesn't just organize chaos—it's your secret weapon against the dreaded escalation spiral. By centralizing all customer interactions in one digital war room, your entire team can swoop in like customer service Avengers, collaborating in real-time on tricky tickets instead of playing hot potato with problems.
No more "passing the issue around" like it's a fruitcake nobody wants! Plus, those AI insights will highlight recurring headaches before they become full-blown migraines, letting you squash problems while they're still tiny, insignificant bugs.
Agent touches
Agent touches refer to the number of interactions or steps an agent takes to resolve a customer query Fewer touches often indicate streamlined workflows and well-trained agents, while higher numbers may suggest inefficiencies or complex issues requiring multiple follow-ups.
Tracking agent interactions helps you identify bottlenecks in your processes. For example, if agents frequently need to escalate queries or request additional information, it may point to gaps in training or inadequate resources. Reducing unnecessary touchpoints can improve customer satisfaction by providing quicker resolutions and minimising frustration.
Tickets solved
Top customer service metrics, such as the number of tickets solved, are crucial indicators for assessing the performance of customer service teams. It measures how effectively your agents handle customer queries. A higher number of resolved tickets often reflects a well-organised support system, while a lower count may signal inefficiencies or resource constraints.
Different industries have varying resolution rates. For instance:
Industry | Average Resolution Rate |
|---|---|
Overall | 76.2% |
Customer service | 76% |
E-commerce | 80% |
Tracking this metric helps you assess your team’s performance and identify areas for improvement.
Enhancing ticket resolution with automation
Automation plays a crucial role in improving ticket resolution rates. It reduces the Mean Time to Repair (MTTR), enabling quicker issue resolution and minimising downtime. Here’s how automation can benefit your support process:
Reduces MTTR, leading to faster resolutions and improved customer satisfaction.
Allows agents to focus on strategic tasks, boosting overall productivity.
Optimises personnel resources, resulting in significant cost savings.
AI-powered tools enable you to automate repetitive tasks and streamline workflows. For example, chatbots can handle FAQs, ensuring quicker resolutions and freeing agents to tackle more complex issues.
Abandonment rate
The abandonment rate measures the percentage of abandoned customer service enquiries that end before resolution. This metric is critical for understanding customer behaviour and identifying areas where your service may fall short. Typical abandonment rates range from 2% to 5%, depending on the industry. For instance:
Telecommunications and retail often achieve lower rates, closer to 2%.
High-volume call centres, such as those in financial services, may see rates between 5% and 8%.
High abandonment rates can lead to dissatisfied customers and lost revenue. Monitoring this metric helps you identify patterns and implement strategies to improve customer retention. Reducing abandonment rates requires a proactive approach. Here are some effective methods:
Leverage real-time monitoring: Identify when customers are likely to abandon interactions and address delays promptly.
Offer a call-back option: Allow customers to continue their day while waiting for a response.
Provide rough waiting times: Inform customers of estimated wait times to reduce frustration.
Review staffing levels: Ensure adequate staffing during peak times, like festive holidays to handle higher volumes.
Support staff with AI solutions: Use AI tools like Cue to enhance customer experience and streamline service.
Improving response times and offering multiple communication channels can reduce abandonment rates and enhance customer satisfaction.
Self-Service Usage
Self-service tools have become a cornerstone of modern customer support. They empower customers to find solutions independently, reducing the need for direct interaction with support agents. This approach not only saves time but also enhances satisfaction.
Research highlights that approximately 67% of customers prefer self-service options over speaking to an agent. Furthermore, 91% would use a knowledge base if it effectively addressed their needs. These statistics underscore the growing demand for accessible and reliable self-service resources.
Effective self-service tools offer several advantages:
Frictionless experience: Customers can access information effortlessly, improving their overall experience.
24/7 availability: Support resources remain accessible at any time, catering to customers outside regular business hours.
Increased efficiency: By reducing call volumes, self-service tools allow support teams to focus on complex issues.
Scalability: Businesses can support a growing customer base without additional staffing.
Smooth onboarding: New users can navigate products more effectively with self-service resources.
Preferred communication channel
Understanding customer preferences for communication is essential for delivering effective support. Preferences often vary by demographic. For instance:
Young people (Generation Z and younger millennials): Favour digital communication channels such as Instagram, Snapchat, and messaging apps like WhatsApp.
Adults (Generation X and older millennials): Prefer email and Facebook for general communication but often choose telephone for complex issues.
Seniors (baby boomers and earlier generations): Lean towards traditional methods like telephone and email, though they also use social media less frequently.
Voice remains the most widely used communication channel, with 73% of customers relying on it for service. Chat is gaining popularity, and adoption is increasing every year. Email remains a staple, and usage is rising annually. Tracking these preferences helps you tailor your support strategy to effectively meet customer needs.
Optimise popular channels for better service
Optimising communication channels involves ensuring they function efficiently and meet customer expectations. Here are some strategies:
Monitor customer feedback: Use surveys and reviews to assess the effectiveness of your communication channels.
Enhance channel functionality: Ensure all platforms operate smoothly to avoid frustrating customers.
Adopt a unified approach: Integrate multiple channels to provide consistent interactions across platforms.
Cue excels in this area by offering a unified inbox that consolidates all customer interactions. This feature enables your team to manage conversations across various channels without losing context. Additionally, chatbots for platforms like WhatsApp, ensure you can cater to customers on their preferred platforms. By optimising your communication channels, you can improve customer satisfaction and foster loyalty.
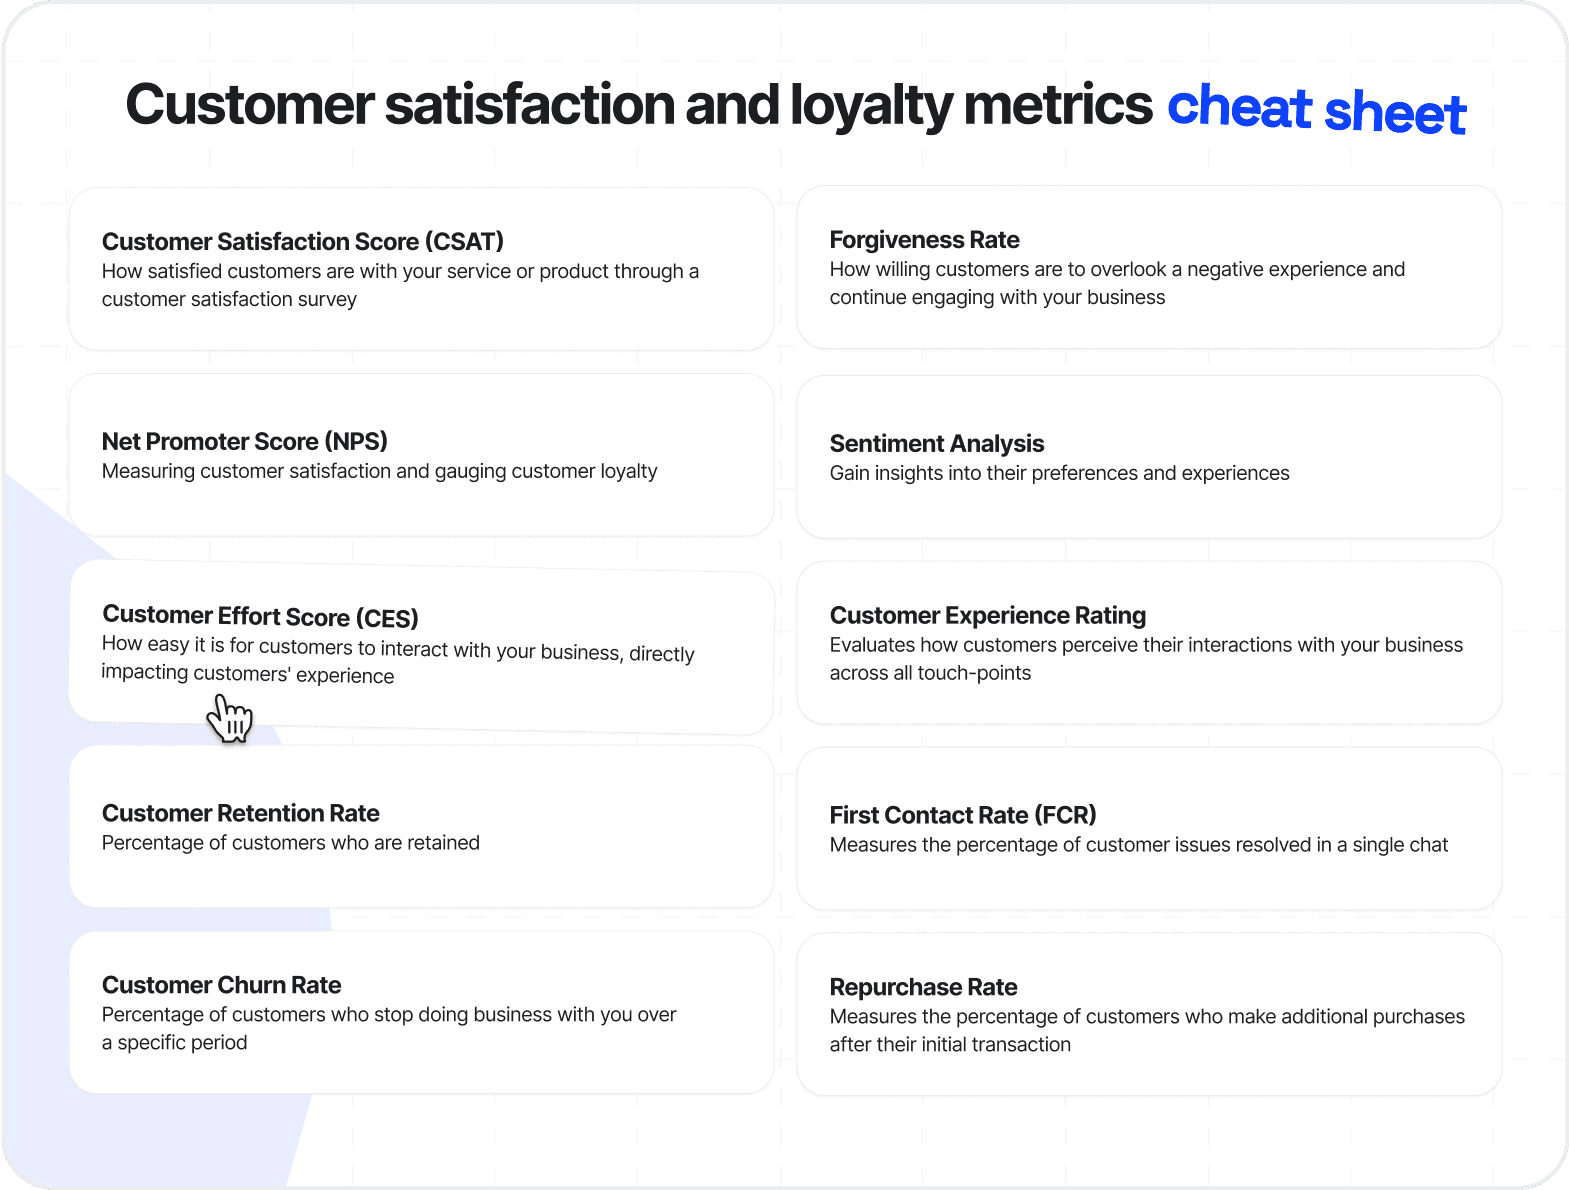
Customer satisfaction and loyalty metrics
Customer satisfaction score (CSAT)
Customer Satisfaction Score (CSAT) measures how satisfied customers are with your service or product through a customer satisfaction survey. It is typically calculated by asking customers to rate their satisfaction on a scale, such as 1 to 5 or 1 to 10. This metric provides direct insights into customer happiness and helps you identify areas for improvement.
Across industries, CSAT scores vary significantly. For example:
E-commerce & Retail: 84
Consulting: 82
Healthcare: 78
B2B Software & SaaS: High 70s
Digital Marketing Agency: 70
Education: 66
Communication & Media: 19
A high CSAT score indicates that your customers are satisfied, which often leads to increased loyalty and positive word-of-mouth. On the other hand, a low score highlights dissatisfaction, which could result in customer churn.
Measure and improve CSAT with analytics
To measure CSAT, you can use customer satisfaction surveys, post-interaction surveys, or feedback forms. These tools allow you to gather customer opinions immediately after a service interaction. Improving CSAT requires a data-driven approach. Cue analytics tools can help you achieve this by offering actionable insights.
Consider leveraging WhatsApp broadcasts for CSAT surveys. This method often yields high response rates due to the platform’s widespread use and convenience.
Here are some best practices to enhance CSAT:
Collect feedback from diverse sources, including surveys (including WhatsApp broadcasts), and social media.
Focus on data relevant to your goals.
Use natural language processing (NLP) to interpret customer sentiment.
Analyse emotional trends and topic-specific feedback.
Personalize interactions based on sentiment insights.
Train your team to act on feedback effectively.
By following these steps, you can address customer concerns proactively and improve satisfaction levels.
Net Promoter Score (NPS)
Net Promoter Score (NPS) is a crucial tool for measuring customer satisfaction and gauging customer loyalty by asking a simple question: “How likely are you to recommend our service to others?” Customers respond on a scale of 0 to 10, with scores categorised as:
Promoters (9-10): Loyal customers who actively recommend your brand.
Passives (7-8): Satisfied but not enthusiastic customers.
Detractors (0-6): Unhappy customers who may discourage others from using your service.
NPS is a strong predictor of customer loyalty and business growth. For instance, sectors like B2B Software & SaaS and Logistics & Transportation have average NPS scores of 40, while Communication & Media scores as low as 19. A higher NPS indicates a loyal customer base, which often translates to increased revenue and reduced churn.
Tips to increase NPS scores using personalised customer interactions
Improving NPS involves building stronger relationships with your customers. Personalisation plays a key role in this process. Here are some strategies:
Use customer data to tailor interactions and offer relevant solutions.
Implement AI-driven tools to analyse customer preferences and behaviours.
Address detractors’ concerns promptly to turn them into promoters.
Celebrate promoters by offering exclusive rewards or recognition.
Cue analytics capabilities allow you to track NPS trends and identify areas for improvement. By focusing on personalised interactions, you can foster loyalty and encourage customers to recommend your brand.
Customer Effort Score (CES)
Customer Effort Score (CES) measures how easy it is for customers to interact with your business, directly impacting customers' experience. It focuses on the effort required to resolve issues, make purchases, or access support. A lower CES indicates a smoother experience, which often leads to higher satisfaction and loyalty.
High effort levels can frustrate customers and drive them to competitors. By reducing effort, you can enhance the overall customer experience and build long-term relationships.
Reduce customer effort for better experiences with automation
Automation is a powerful tool for reducing customer effort. Here are some effective methods:
Deploy chatbots to handle frequently asked questions and provide instant responses.
Use ticketing systems to route queries to the right departments and keep customers informed.
Implement help desk software to manage queries from multiple channels in one place.
Automate repetitive tasks, such as sending initial responses, to save time.
AI-driven solutions simplify customer interactions by automating routine tasks and providing 24/7 support. For example, its chatbots can assist with common queries, allowing your team to focus on complex issues.

Customer retention rate
Customer service success is critical for long-term business success. Acquiring new customers often costs five times more than keeping existing ones. A high retention rate not only reduces acquisition costs but also increases customer lifetime value. On average, businesses across industries achieve a retention rate of 72.5%. However, companies with effective customer service and engagement strategies often exceed this benchmark.
Several factors contribute to higher retention rates:
Effective customer service: Resolving issues promptly builds trust and loyalty.
Loyalty programmes: Rewarding repeat customers encourages them to stay.
Engaging communication: Regular updates via email or social media keep customers connected to your brand.
By focusing on these areas, you can create a loyal customer base that drives consistent revenue growth.
Improve retention rates using targeted messaging
Targeted messaging allows you to personalise communication, making customers feel valued. This approach strengthens relationships and encourages repeat business. Below are some effective strategies for improving retention through targeted messaging:
Strategy | Description |
User segmentation | Tailor messages to specific customer personas to address their unique needs and preferences. |
Create 'Wow Moments' in onboarding | Help customers achieve early successes to increase their likelihood of staying long-term. |
Consistent communication | Align messaging across departments to provide a cohesive and positive customer experience. |
Customer churn rate
Customer churn rate measures the percentage of customers who stop doing business with you over a specific period. A high churn rate indicates dissatisfaction or unmet expectations, which can harm your revenue and brand reputation.
Reduce churn through proactive measures and real-time insights
Proactive measures can significantly reduce churn by addressing customer concerns before they escalate. Here are some effective strategies:
Begin retention efforts during customer acquisition.
Use in-app messages to guide users towards features that enhance their experience.
Monitor interactions to identify at-risk customers early.
Additionally, you can:
Implement smart dunning workflows to recover failed transactions.
Offer discounts based on customer eligibility to retain their business.
Enhance onboarding processes to ensure customers understand your product’s value.
Act on customer feedback to show you value their opinions.
Real-time analytics enable you to track customer behaviour and detect early signs of dissatisfaction. By addressing these issues promptly, you can reduce churn and foster loyalty.
Sentiment analysis
By analysing reviews, social media mentions, and feedback, you can gain insights into their preferences and experiences. This information supports informed decision-making and allows you to refine your strategies. Key benefits of sentiment analysis include:
Identifying customer sentiment towards your brand.
Improving marketing strategies and product offerings.
Detecting and addressing negative feedback to maintain a positive brand image.
For example, monitoring social media can reveal trends in customer satisfaction, helping you adjust your approach to meet their expectations.
Forgiveness rate
The forgiveness rate measures how willing customers are to overlook a negative experience and continue engaging with your business. This metric reflects the strength of your relationship with customers and their trust in your brand. A high forgiveness rate indicates that customers value your service enough to give you another chance, even after a mistake.
Building trust through exceptional service
Building trust requires consistent effort and a customer-first approach. Exceptional service plays a key role in earning forgiveness. When you resolve issues promptly and exceed expectations, customers are more likely to forgive occasional errors.
Personalised support further strengthens this bond by showing customers that you understand their unique needs. You will have to find more creative ways to track this such as follow-up surveys and see how many return to use your product or service after a bad experience.
Here are some strategies to enhance trust and improve forgiveness rates:
Acknowledge mistakes: Take responsibility for errors and communicate transparently with customers.
Offer meaningful solutions: Provide compensation or alternatives that address the issue effectively.
Use customer data wisely: Leverage tools like Cue to personalise interactions and anticipate customer needs.
Train your team: Equip agents with the skills to handle complaints empathetically and professionally.
You can foster stronger relationships and encourage customers to remain loyal, even when challenges arise.
Customer experience rating
Customer experience rating evaluates how customers perceive their interactions with your business across all touchpoints. This metric provides a holistic view of customer satisfaction and highlights areas for improvement. You can collect this data through surveys, feedback forms, or online reviews.
Enhancing experiences through feedback
Improving customer experience requires actionable insights. Feedback from customers is invaluable for identifying pain points and opportunities for improvement. Analytics tools, such as those offered by Cue, can help you interpret this data and implement targeted solutions.
Here are some practical steps to enhance customer experiences:
Analyse feedback trends: Identify recurring themes in customer comments to address common issues.
Act on insights: Use data to prioritise improvements that have the greatest impact on satisfaction.
Engage customers proactively: Reach out to customers for their opinions and involve them in shaping your services.
Monitor performance: Continuously track customer experience ratings to measure the effectiveness of your efforts.
By combining feedback with analytics, you can create a more engaging and satisfying experience for your customers.
Repurchase rate
The repurchase rate measures the percentage of customers who make additional purchases after their initial transaction. This metric serves as a strong indicator of customer loyalty and satisfaction. A high repurchase rate suggests that customers trust your brand and find value in your offerings.
Encouraging repeat business
Encouraging repeat purchases requires a combination of excellent service and strategic incentives. Superior service ensures that customers have a positive experience, making them more likely to return. Targeted promotions, on the other hand, provide additional motivation for repeat business.
Here are some strategies to boost repurchase rates:
Personalise offers: Use customer data to create tailored promotions that resonate with individual preferences.
Reward loyalty: Implement programmes that recognise and reward repeat customers.
Maintain consistent quality: Ensure that every interaction meets or exceeds customer expectations.
Communicate effectively: Keep customers informed about new products, services, or special offers.
First Contact Resolution Rate (FCR)
First Contact Resolution Rate measures the percentage of customer issues resolved in a single interaction - or as we like to call it, the "one and done" metric. Think of it as your support team's ability to nail it on the first try, like getting the perfect cup of tea without having to add more milk.
Improve FCR through training and tools
Boosting your FCR is like training for a marathon - it takes preparation, the right tools, and maybe a few energy drinks (for the agents, not the customers). Here are some ways to improve:
Equip your team with comprehensive knowledge bases (because nobody likes saying "Let me check with my supervisor" five times a day)
Implement robust training programmes that cover common scenarios (so agents aren't caught deer-in-headlights style)
Use analytics to identify which issues consistently require multiple contacts (these are your FCR party poopers)
Empower agents to make decisions without endless escalations (because nobody enjoys a game of "pass the customer")
Industry averages for FCR typically hover between 70-75%, but top performers can achieve rates of 80% or higher. Just remember, while striving for high FCR is important, it shouldn't come at the expense of actually solving the customer's problem properly. Sometimes, a thorough resolution in two contacts is better than a rushed job in one!
Cue’s analytics tools can help you identify patterns in customer behaviour and craft targeted campaigns. By focusing on these strategies, you can build lasting relationships and drive repeat business. Book a demo today and make your customer service amazingly fast!

Frequently asked questions
How does Cue help improve customer service metrics?
Cue provides tools like AI-driven chatbots, real-time analytics, and a unified inbox. These features allow you to monitor key metrics, automate repetitive tasks, and enhance team productivity. With Cue, you can deliver faster responses and better resolutions.
Which customer service metric is the most important?
No single metric is universally the most important. The significance depends on your business goals. For example, First Response Time (FRT) is crucial for quick support, while Customer Satisfaction Score (CSAT) measures overall happiness. Combining multiple metrics offers a comprehensive view.
How can you reduce customer churn?
Reducing churn involves proactive engagement. Use tools like Cue to monitor customer behaviour and identify dissatisfaction early. Offer personalised solutions, improve onboarding, and address feedback promptly to retain customers and build loyalty.
Why is tracking self-service usage important?
Self-service usage indicates how effectively customers can resolve issues independently. High usage reduces support team workload and improves customer satisfaction. Tools like Cue chatbots guide users through common queries, making self-service more accessible and efficient.
